> For the complete documentation index, see [llms.txt](https://docs.ibexa.ai/llms.txt). Markdown versions of documentation pages are available by appending `.md` to page URLs; this page is available as [Markdown](https://docs.ibexa.ai/tutorials/building-a-data-analysis-agent.md).
# Building a Data Analysis Agent
| **Time to complete** | \~25 minutes |
| -------------------- | ---------------------------------------------------------------------------------------------------------------------------------------------------------------- |
| **Who this is for** | Marketing team members, Content Editors, and anyone who needs to turn a raw data file into a clear, visual sales report - without writing a single line of code. |
## What You Will Build
By the end of this tutorial you will have a working **Sales Analytics Agent** - an agent that reads a retail sales dataset you attach to the conversation, analyses it, and produces a structured report complete with charts and key insights. The report will answer questions that matter to your team:
* Which product category generates the most revenue?
* How did sales trend month by month throughout the year?
* Who are the customers - and does purchasing behaviour differ by age or gender?
* What is the average transaction value, and which categories drive it? You will use a real-world sample dataset from Kaggle, a public data platform, as your source material. Once you understand the pattern, you can repeat the same steps with any sales or performance data your organisation already has.
## Prerequisites
Before you start, make sure the following are in place:
* At least one **AI model** has been connected and enabled. Go to **Organisation → AI Models** and confirm a model is listed. If none are available, ask your administrator or see \[AI Models]\(../manual/AI Models.md).
* The **Reports MCP Server** is available in your organisation. This is a built-in server, no external account or credentials are needed. Go to **Organisation → MCP Servers** and confirm a server named **Reports** appears in the list. If it is missing, ask your administrator.
* You have a free Kaggle account, or can create one - instructions are in Step 2 below.
## Overview of the Steps
1. Understand the dataset
2. Download the dataset from Kaggle
3. Explore the data with the built-in AI Assistant
4. Create the Sales Analytics Agent
5. Run the agent and review the report
## Step 1 - Understand the Dataset
Before working with any data, it helps to know what you are looking at. The dataset used in this tutorial is the **Retail Sales Dataset** - a clean, beginner-friendly sample of one year of retail transactions from a fictional store.
### What the data represents
The dataset covers **1,000 sales transactions** made throughout **2023**. Each row is one purchase made by one customer on one date. It is designed to reflect realistic retail patterns across three product departments, making it ideal for practising sales analysis.
### Column-by-column breakdown
| **Column** | **Type** | **What it contains** |
| -------------------- | -------- | -------------------------------------------------------------------------------------- |
| **Transaction ID** | Number | A unique number for each sale (1 through 1,000) |
| **Date** | Date | The date of the transaction (format: YYYY-MM-DD, all within 2023) |
| **Customer ID** | Text | A unique identifier for each customer (e.g. `CUST001`) |
| **Gender** | Text | The customer's gender - `Male` or `Female` |
| **Age** | Number | The customer's age in years (range: 18–64) |
| **Product Category** | Text | The department the product belongs to - one of: `Beauty`, `Clothing`, or `Electronics` |
| **Quantity** | Number | How many units were purchased in that transaction (1–4) |
| **Price per Unit** | Number | The selling price of a single unit, in USD (values: $25, $30, $50, $300, $500) |
| **Total Amount** | Number | The total value of the transaction - always `Quantity × Price per Unit` |
### What you can learn from this data
With these nine columns you can answer a wide range of business questions:
* **Revenue analysis** - which category or month contributes most to total revenue?
* **Customer demographics** - how do male and female shoppers differ in their spending? Which age groups spend the most?
* **Volume vs. value** - does a category sell more units but at lower prices, or fewer units at a premium?
* **Seasonal trends** - are there months where sales spike or drop?
### A quick look at a few rows
Here is what the raw data looks like:
| **Transaction ID** | **Date** | **Customer ID** | **Gender** | **Age** | **Product Category** | **Quantity** | **Price per Unit** | **Total Amount** |
| ------------------ | ---------- | --------------- | ---------- | ------- | -------------------- | ------------ | ------------------ | ---------------- |
| 1 | 2023-11-24 | CUST001 | Male | 34 | Beauty | 3 | $50 | $150 |
| 2 | 2023-02-27 | CUST002 | Female | 26 | Clothing | 2 | $500 | $1,000 |
| 3 | 2023-01-13 | CUST003 | Male | 50 | Electronics | 1 | $30 | $30 |
| 13 | 2023-08-05 | CUST013 | Male | 22 | Electronics | 3 | $500 | $1,500 |
| 15 | 2023-01-16 | CUST015 | Female | 42 | Electronics | 4 | $500 | $2,000 |
Notice how the same product category (Electronics) spans a huge price range, from a $30 item to a $500 item, and how Total Amount is simply Quantity multiplied by Price per Unit. These are the kinds of patterns the agent will surface automatically.
## Step 2: Download the Dataset from Kaggle
**Kaggle** () is a free public platform for datasets and data science projects. You will download the retail sales file from there.
### 2.1 - Create a free Kaggle account (if you don't have one)
1. Go to [https://www.kaggle.com/.](https://www.kaggle.com/)
2. Select **Register** in the top-right corner.
3. Sign up with your Google account or email address.
4. Verify your email if prompted.
### 2.2 - Download the dataset
1. Go directly to the dataset page:
2. You may be asked to sign in - log in with the account you just created.
3. On the dataset page, select the **Download** button (top-right area, above the file list).
4. Kaggle downloads a `.zip` file to your computer.
5. Locate the downloaded `.zip` file and extract (unzip) it. Inside you will find a file named `retail_sales_dataset.csv`.
> **What is a CSV file?** A CSV (Comma-Separated Values) file is a plain-text spreadsheet - every row is a transaction, and the columns are separated by commas. You can open it in Excel or Google Sheets to take a look, but you don't need to - the platform will read it directly.
## Step 3: Explore the Data with the AI Assistant
Before building an agent, it is worth getting a feel for what is in the dataset. You can do this right now by attaching the CSV file directly to a conversation with the platform's built-in AI Assistant and asking it questions.
### 3.1 - Open the AI Assistant
Select **Ask AI** in the top bar. The assistant panel slides in from the right.
> **Note:** The Ask AI button requires a Default Assistant Agent to be configured for your organisation. If the button is greyed out, ask your administrator to set one in **Organisation → Settings**, or see \[Organisation Settings]\(../manual/Organisation Settings.md).
### 3.2 - Attach the CSV file
In the assistant panel, look for the **attachment icon** (paperclip) in the message input area at the bottom of the panel.
1. Select the attachment icon.
2. Choose `retail_sales_dataset.csv` from your computer.
3. The file appears as an attachment preview above the input field, confirming it has been added to the message.
### 3.3 - Ask your first exploratory question
With the file attached, type the following message and press **Enter**:
```
I've attached a retail sales CSV file. What columns does it have and what does each one represent?
```
The assistant reads the attached file and describes its structure. Each subsequent message in this conversation will retain the file as context - you do not need to re-attach it for follow-up questions.
### 3.4 - Ask more exploratory questions
Try the following prompts to get a sense of the data before building the full report: **Check the scope:**
```
What date range does this data cover, and how many transactions are there in total?
```
**Get a quick summary:**
```
What are the three product categories in this dataset? Which one appears most frequently?
```
**Spot patterns:**
```
What is the highest-value transaction in the dataset? What product category was it?
```
**Demographic overview:**
```
Is the customer base roughly split evenly between male and female shoppers, or does one gender dominate?
```
**Tip**: These short exploratory questions take seconds and help you decide which angles to focus on in your report. You are not committing to anything - just getting familiar with what the data contains before you automate the full analysis.
### 3.5 - Close the assistant when you're done
Select the close button inside the assistant panel, or select **Ask AI** in the top bar again to dismiss it. You will now build an agent to produce a full, repeatable analysis.
## Step 4L Create the Sales Analytics Agent
Now you will create an agent that reads the dataset you attach to it, performs a thorough analysis, and writes a structured report with charts and insights.
### 4.1 - Open the Agents page
Select **Agents** in the main navigation menu, then select **Add Agent** in the top-right corner. The **Agents Browser** opens. Select **Add Custom Agent** to go directly to the creation wizard.
### 4.2 - Step 1 of 6: Instructions
The instructions are the agent's brief. They tell it how to process the data, which calculations to run, and how to build the report block by block using the Reports MCP Server. Paste the following into the **Instructions** field:
```
You are a sales analytics agent. Your job is to read a retail sales CSV file attached to the conversation, analyse the data, and build a structured visual report using the Reports MCP Server tools.
Follow these steps in order:
## STEP 1 - CALCULATE THE DATA
Read the attached CSV and calculate (using given tools) the following metrics:
- Total revenue (sum of all Total Amount values)
- Average transaction value (mean of Total Amount)
- Number of unique customers (count of distinct Customer ID values)
- Total revenue per category (Beauty, Clothing, Electronics) and each category's share of total revenue (%)
- Total revenue and transaction count per month (January–December 2023); identify the best and worst months
- Total revenue, average transaction value, and top category per gender (Male, Female)
- Total revenue, transaction count, and top category per age band: 18–25, 26–35, 36–45, 46–55, 56–64
- Top 10 transactions by Total Amount, sorted descending
## STEP 2 - BUILD THE REPORT
Build the report with the following structure:
- **Retail Sales Analysis - 2023** *(report title)*
- **Executive Summary** - 3–5 sentences summarising total revenue, best-performing category, notable monthly and demographic trends. Base every statement strictly on the calculated data.
- **Key Metrics** - three metric blocks side by side: Total Transactions, Total Revenue (USD), Average Transaction Value (USD)
- **Revenue by Product Category** - bar chart of revenue per category + table: Category | Total Revenue (USD) | Share of Total (%)
- **Monthly Sales Trend** - line chart of monthly revenue (Jan–Dec 2023) + table: Month | Transactions | Total Revenue (USD)
- **Sales by Gender** - pie chart of revenue share by gender + table: Gender | Total Revenue (USD) | Avg Transaction Value (USD) | Top Category
- **Customer Age Analysis** - bar chart of revenue by age band + table: Age Band | Transactions | Total Revenue (USD) | Top Category
- **Top 10 Transactions** - table: Transaction ID | Date | Customer ID | Gender | Age | Category | Qty | Price per Unit | Total Amount
- **Key Insights and Recommendations** - 4–6 bullet points with actionable insights for a marketing or sales team. Base every point strictly on the data - no invented figures or assumptions.
## STEP 3 - FINALISE
Summarize and share the returned link with the user so they can open the report directly.
## RULES
- Round all monetary values to 2 decimal places; all percentages to 1 decimal place.
- Do not invent data or make assumptions beyond what is in the attached file.
- If a calculation cannot be completed, say so clearly and continue with the remaining sections.
```
Select **Next**.
### 4.3 - Step 2 of 6: Triggers
You want to be able to run this agent on demand - for example, whenever you have a new dataset ready to analyse.
1. Select **Add trigger**.
2. Choose **Run Now** from the trigger type list.
3. Leave all settings at their defaults. Select **Next**.
### 4.4 - Step 3 of 6: Tools
The agent builds the report using the **Reports MCP Server**, a built-in server that gives agents the ability to create reports, add charts, tables, and metrics, and publish the result. You need to connect it here.
1. Select **Select tools**.
2. Find **IAMP** **Reports** in the server list
3. Select the server to expand its tool list, then tick **all available tools**:
| **Tool** | **What the agent uses it for** |
| ------------------------ | ------------------------------------------------------------------------- |
| `create_report` | Creates a new empty report and returns its ID |
| `add_block` | Appends each content block (charts, tables, text, metrics) to the report |
| `update_report_metadata` | Sets the report title and summary when the report is complete |
| `get_report_url` | Returns the direct link to the finished report |
| `aggregate_data` | Groups and sums CSV rows in memory (e.g. revenue per category, per month) |
| `calculate` | Computes derived values - averages, percentages, totals |
| `get_report_blocks` | Reads existing blocks if the agent needs to review or update them |
| `update_block` | Corrects a block if a value needs changing |
| `delete_block` | Removes a block if it needs replacing |
Confirm the selection and return to the wizard. Select **Next**.
### 4.5 - Step 4 of 6: Knowledge Base
| Field | What to select |
| ---------- | ---------------------------------------------------------------------------------------------------- |
| **Access** | **None** - this agent reads from the file you attach to the conversation, not from stored documents. |
Select **Next**.
### 4.6 - Step 5 of 6: Quality Metrics
Leave this step empty for now - you can configure quality monitoring later from the agent's **Edit** page. Select **Next**.
### 4.7 - Step 6 of 6: General Properties
Fill in the agent's identity, model, and limits:
| Field | What to enter |
| --------------------------- | -------------------------------------------------------------------------------------------------------------------------------------------------------------------------- |
| **Name** | `Sales Analytics Agent` |
| **Description** | `Analyses a retail sales CSV attached to the conversation and produces a structured report with charts and key insights.` |
| **Model** | Choose the AI model your organisation has configured (e.g. *GPT-4o*). If you are unsure, ask your administrator. A more capable model will produce more accurate analysis. |
| **Maximum number of steps** | Set to **75** - building a multi-block report with charts, tables, and calculated metrics requires more steps than a simple Q\&A. |
| **Can be sub-agent** | Leave unchecked |
Leave all budget fields at their defaults. Select **Submit**. You are taken to the new agent's detail page.
## Step 5: Run the Agent and Review the Report
### 5.1 - Open the test interface
From the new agent's **detail page**, open the actions menu (top-right corner) and select **Run test**. A chat interface opens with a welcome message.
### 5.2 - Attach the dataset and start the analysis
Before sending your message, attach the CSV file:
1. Select the **attachment icon** (paperclip) in the message input area.
2. Choose `retail_sales_dataset.csv` from your computer. It appears as a preview above the input field.
3. Type the following message and press **Enter**:
```
Please analyse the attached retail sales dataset and produce the full report.
```
### 5.3 - Wait for the analysis to complete
The agent works through a defined sequence of steps: reading the attached file, running aggregations and calculations, then creating the report and adding each block - header, metrics, charts, tables, and insights - one by one. This typically takes **2–4 minutes** depending on the AI model configured. You can watch the agent's progress in the chat interface. You will see it call tools in sequence: first `create_report`, then a series of `aggregate_data` and `calculate` calls, then a stream of `add_block` calls as each section is built.
### 5.4 - Open the finished report
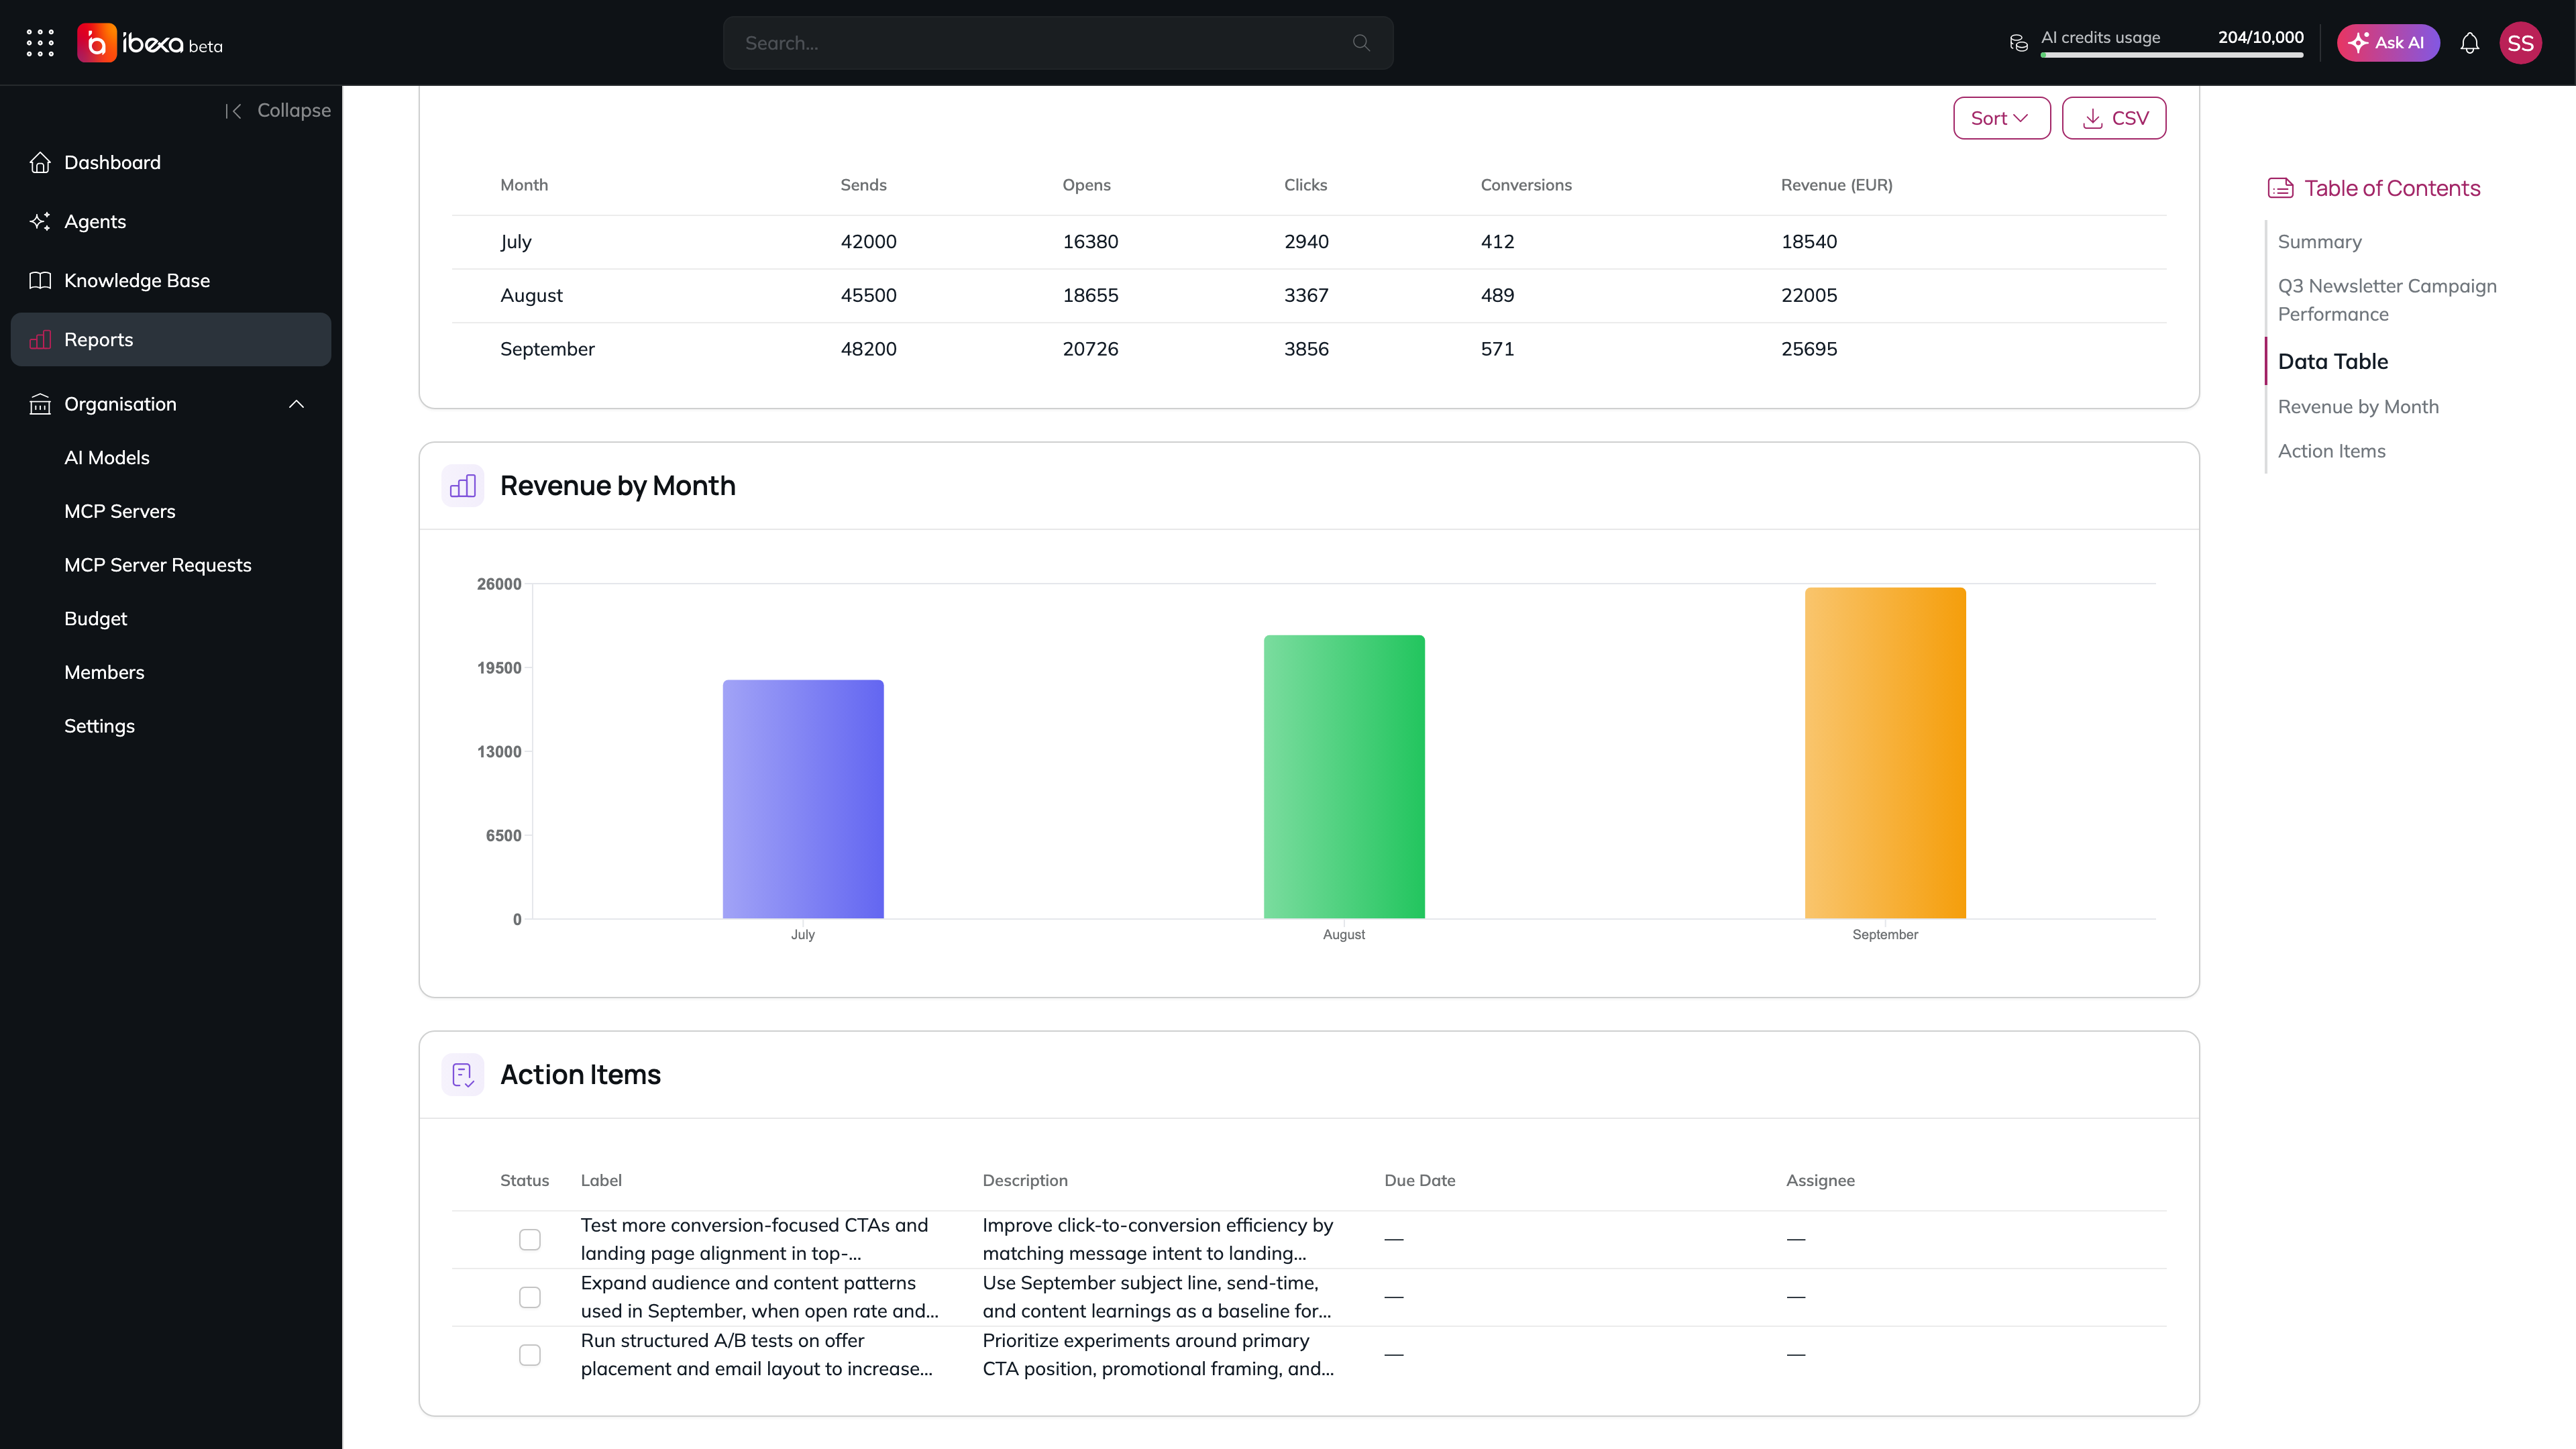
When the agent finishes, it posts a **direct link** to the report in the chat, generated by the `get_report_url` tool. Select the link to open the report immediately. The report is a fully structured document with real rendered content:
* **Metric blocks** showing total transactions, total revenue, and average transaction value side by side
* **Bar charts** for revenue by category and by age band
* **Line chart** for the monthly revenue trend across all 12 months
* **Pie chart** for revenue split by gender
* **Data tables** with exact figures for every section
* **Narrative text** for the executive summary and key insights You can also find the report any time via **Reports** in the main navigation menu.
Example of the content blocks in a generated report
## Troubleshooting
| **Symptom** | **Likely cause** | **Fix** |
| -------------------------------------------------------------- | ----------------------------------------------------------------------------- | ------------------------------------------------------------------------------------------------------------------------------------------------------- |
| Agent says it cannot read the file or find any data | The file was not attached before sending, or the attachment was not confirmed | Re-run the test, attach the CSV again using the attachment icon, and confirm the file preview appears before pressing Enter. |
| Agent fails at `create_report` or any Reports tool call | The Reports MCP Server tools were not enabled on the agent | Edit the agent, go to the Tools step, and confirm all Reports MCP Server tools are ticked. |
| Report is created but some sections or charts are missing | The agent hit its step limit before finishing | Edit the agent and increase **Maximum number of steps** to 100 in General Properties. |
| Figures in charts or tables look incorrect (e.g. zero revenue) | The agent received an empty or corrupted CSV | Re-download the CSV from Kaggle, verify you can open it in Excel or a text editor, then attach the fresh copy. |
| The Ask AI button is greyed out in Step 3 | No default assistant agent is configured | Ask your administrator to set a Default Assistant Agent in Organisation Settings, or see \[Organisation Settings]\(../manual/Organisation Settings.md). |
| File attachment icon is not visible | The message input may need to be clicked first | Select the text input area to activate it - the attachment icon appears once the input is focused. |
## Summary
You have built a fully functional Sales Analytics Agent. Here's what you did:
1. ✅ Understood the structure and content of a real retail sales dataset.
2. ✅ Downloaded the dataset from Kaggle.
3. ✅ Explored the data interactively by attaching the CSV directly to the AI Assistant and asking questions about it.
4. ✅ Created an agent with step-by-step instructions to process the data and build a structured report using the Reports MCP Server - with real bar charts, line charts, a pie chart, metric blocks, data tables, and narrative insights.
5. ✅ Ran the agent - attaching the dataset to the conversation - and opened the finished report via the direct link the agent provided.
## Next Steps
* **Use your own data** - replace the Kaggle dataset with a real sales export from your CRM, e-commerce platform, or ERP system. Attach the new CSV when you run the agent and it will analyse it using the same report structure.
* **Ask follow-up questions** - after reviewing the report, open the **Reports** page, select the report, and use **Ask AI** to dig deeper. For example: *"Which age group has the highest average spend on Electronics?"*
* **Create category-specific agents** - duplicate this agent and adjust the instructions to focus on a single product category, producing a deeper dive for the relevant team (e.g. a Beauty category report for the marketing team).
* **Combine with live data** - pair this agent with an extraction agent (see [Building a Data Extraction Agent](/tutorials/building-an-data-extraction-agent.md)) to automatically pull fresh data from a web source before running the analysis.